August 2020 | Toronto Luxury Real Estate Market Report
To say that the luxury housing market was on fire in August would be a bit of an understatement. Looking at the stats, you can clearly see a substantial increase in the # of sales compared to 2019 with 3-Bed/+ homes leading the way with a 263% gain.


Welcome to the monthly Toronto Luxury Market Report where we'll look at what's been happening in the home & condo sectors for August 2020.
To qualify as a luxury property, we use the following criteria:
Condo
1-Bed/+Den = $750,000 +
2-Bed/+Den = $1,000,000 +
3-Bed/+Den = $1,250,000 +
House
3-Bed/+ = $1,500,000 +
4-Bed/+ = $2,000,000 +
5-Bed/+ = $2,500,000 +
Neighbourhoods with highest average sale price
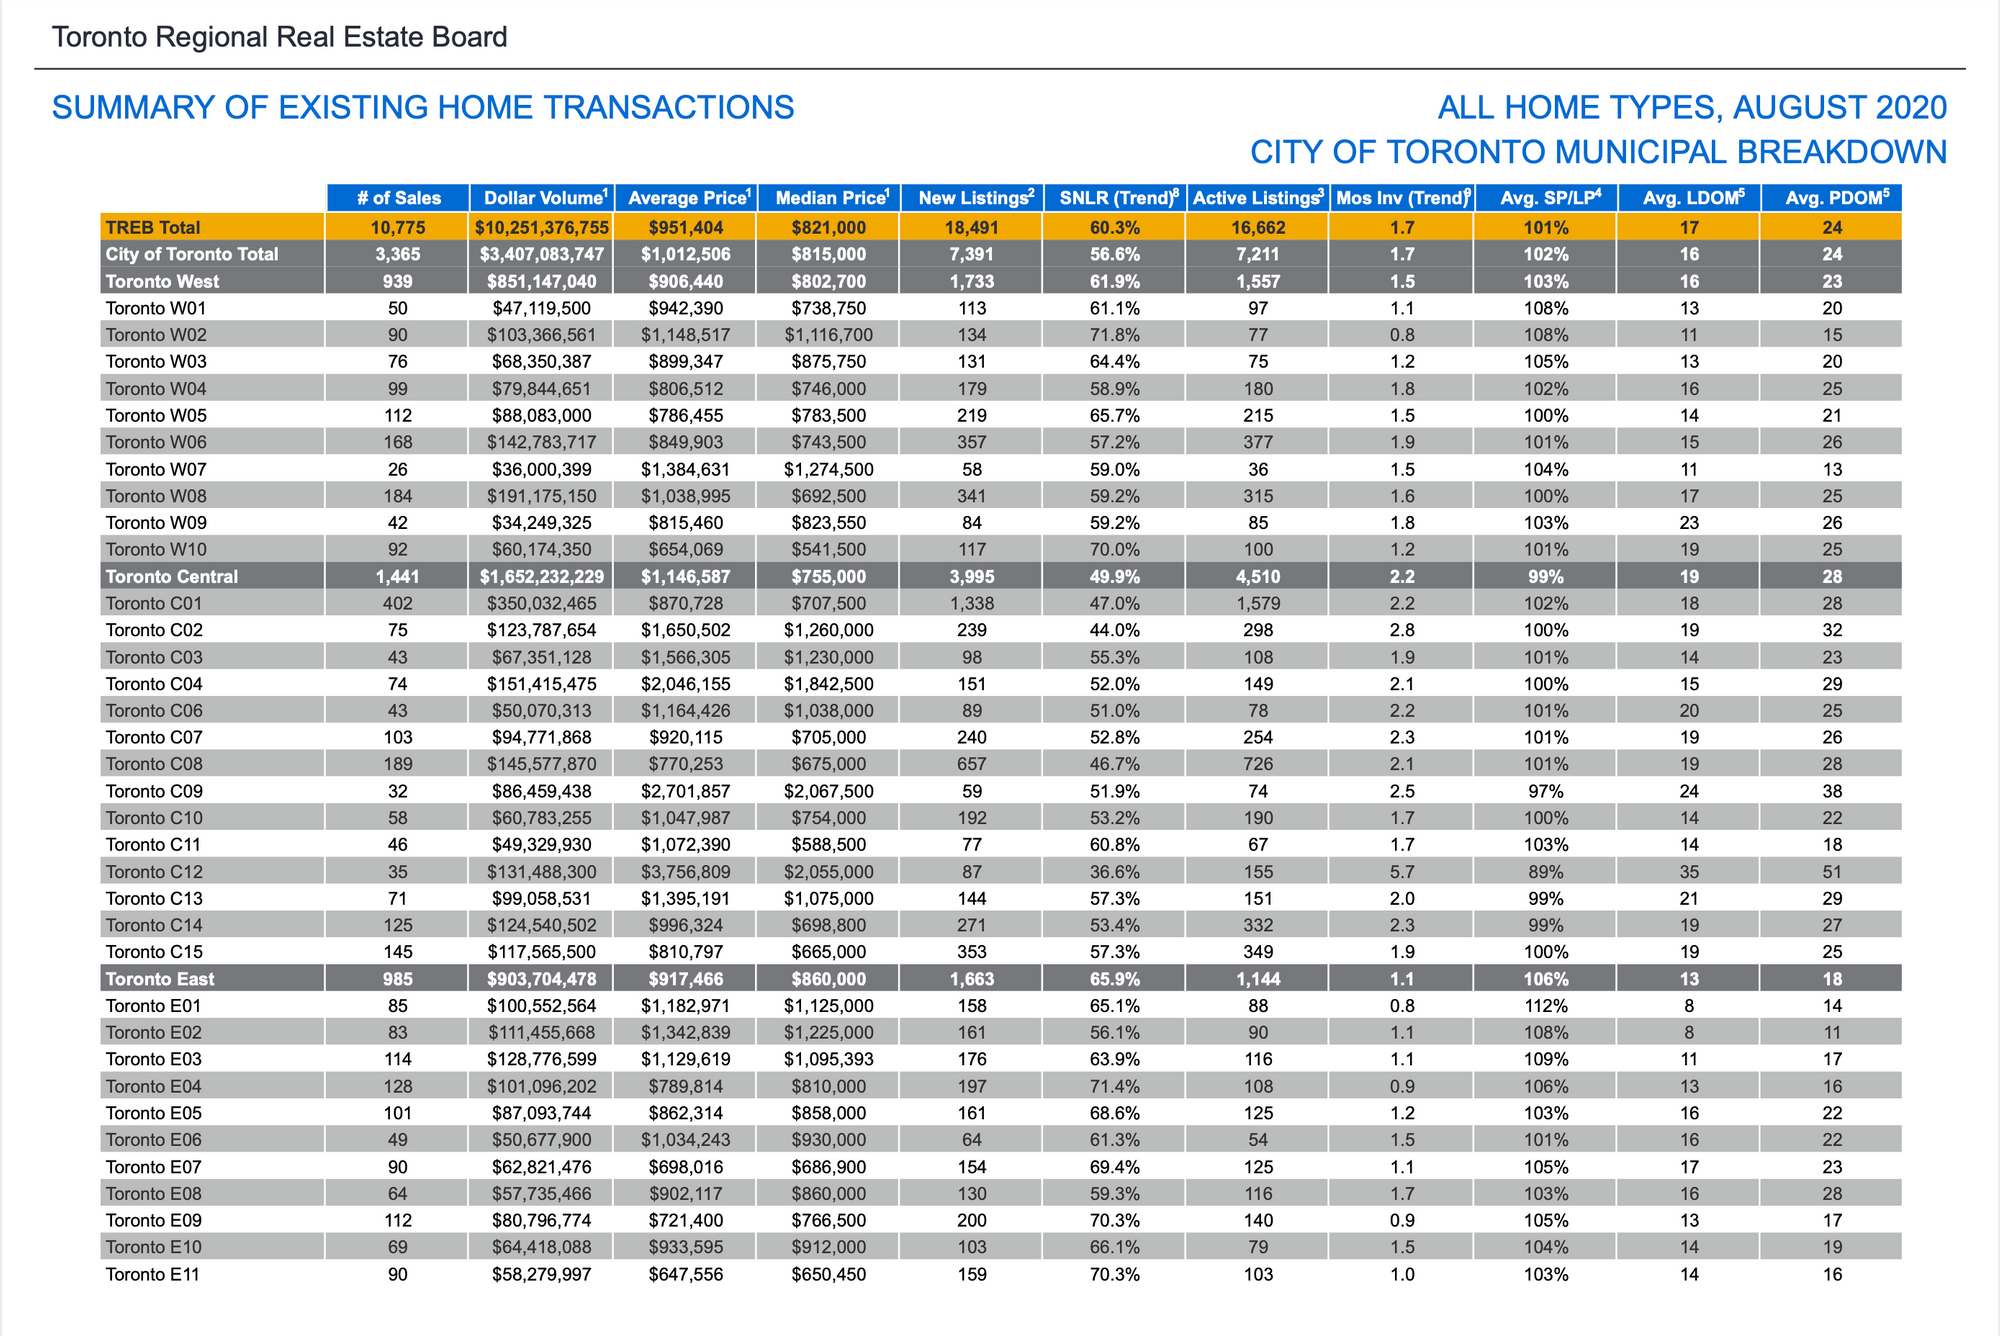
#1 = C12
Bridle Path, Sunnybrook, York Mills & St. Andrew-Windfields
Avg. sale price = $3,756,809
35 Sales
#2 = C09
Rosedale - Moore Park
Avg. sale price = $2,701,857
32 Sales
#3 = C04
Forest Hill North, Lawrence Park North & South, Bedford Park - Nortown & Englemount-Lawrence
Avg. sale price = $2,046,155
74 Sales
#4 = C02
Annex, Casa Loma, Wychwood & Yonge - St.Clair
Avg. sale price = $1,650,502
75 Sales
#5 = C03
Forest Hill South, Homewood-Cedarvale & Oakwood-Vaughan
Avg. sale price = $1,566,305
43 Sales
Condo stats for past month
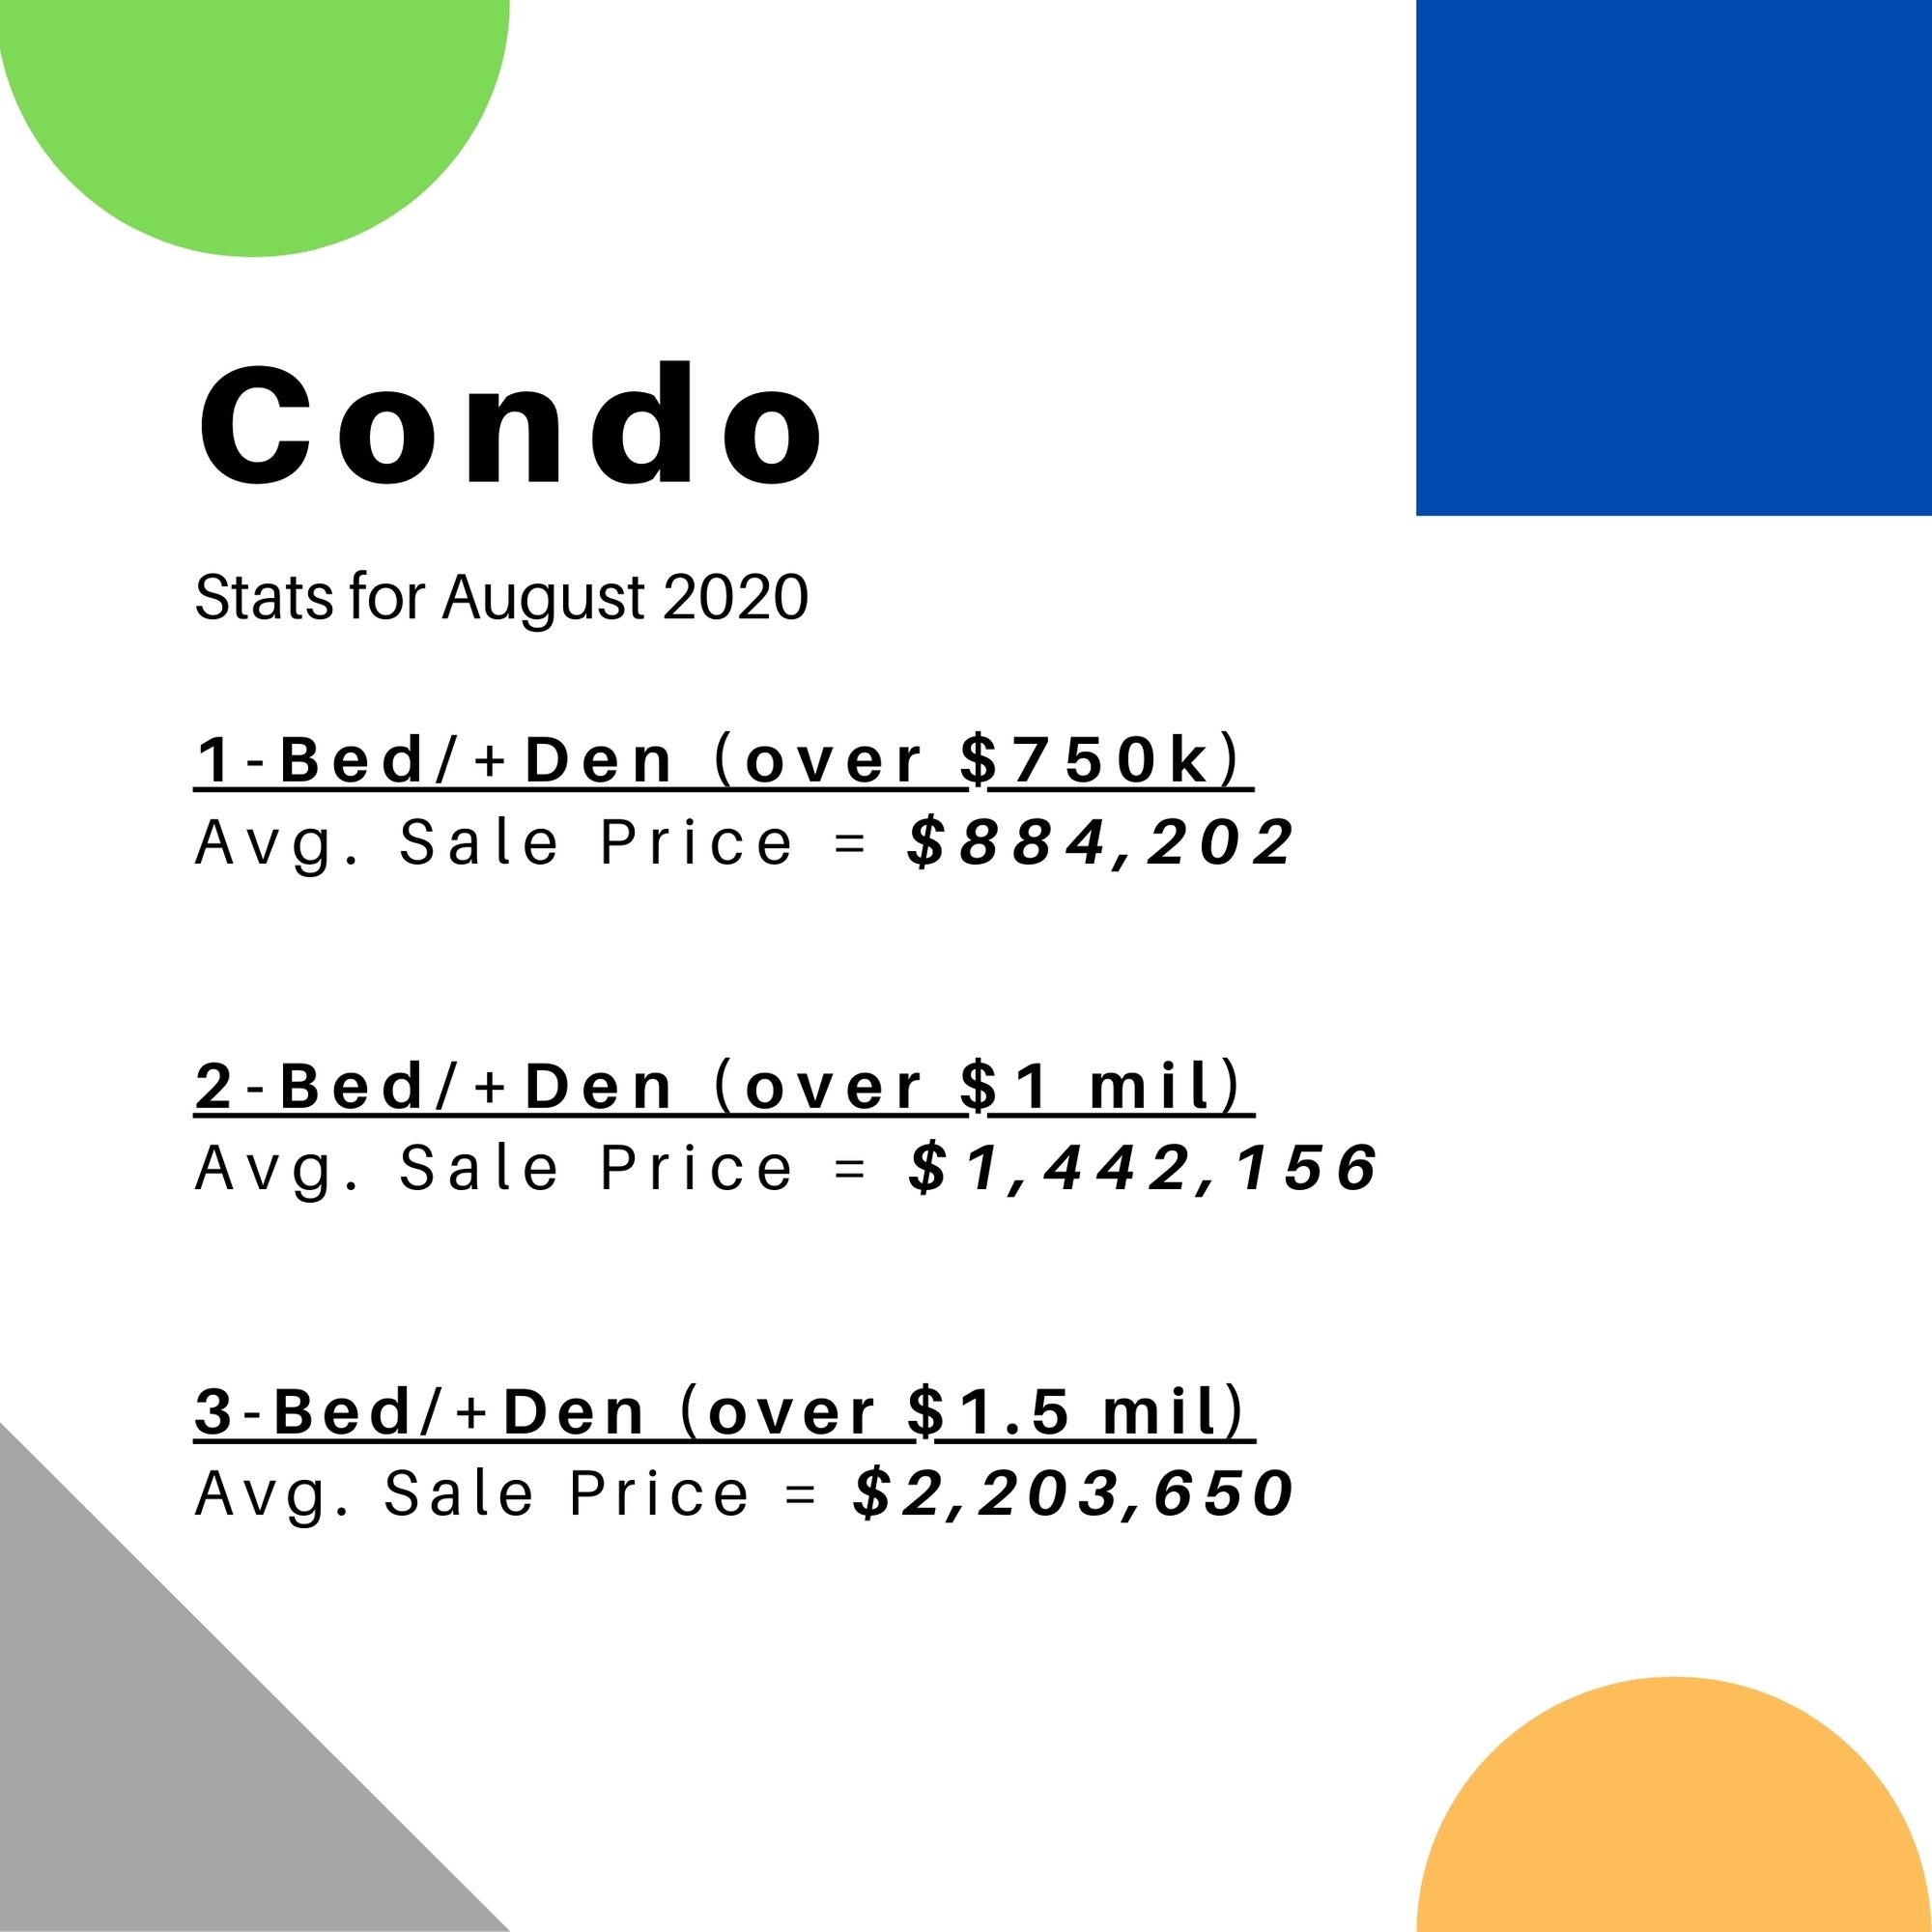
1-Bed/+Den
Avg. Sale Price = $884,202 (up 0.5% vs. 2019)
# of Sales = 44 (up 29% vs. 2019)
Avg. DOM (Days on Market) = 22 (down 37% vs. 2019)
Avg. % of Listing Price = 99%
2-Bed/+Den
Avg. Sale Price = $1,442,156 (down 1.5% vs. 2019)
# of Sales = 95 (up 58% vs. 2019)
Avg. DOM (Days on Market) = 19 (down 46% vs. 2019)
Avg. % of Listing Price = 100%
3-Bed/+Den
Avg. Sale Price = $2,203,650 (up 8% vs. 2019)
# of Sales = 10 (up 150% vs. 2019)
Avg. DOM (Days on Market) = 30 (down 21% vs. 2019)
Avg. % of Listing Price = 98%
Overall the luxury condo market remains quite strong throughout the month of August with a large increase in the # of sales compared to the same period last year.
1-Bed+Den units saw a marginal change in average sale price (up 0.5%), however the days on market dropped by 37% which is an indicator that demand is up as properties are selling faster than they were in 2019.
This trend followed through with 2 & 3-bed condo units which saw a decrease of 46% & 21% respectively in average days on market.
3-Bed units saw the largest price increase vs. 2019 with a 8% uptick which makes sense when you look at the fact many people have shifted their search criteria & are now looking for bigger places to live.
House stats for past month
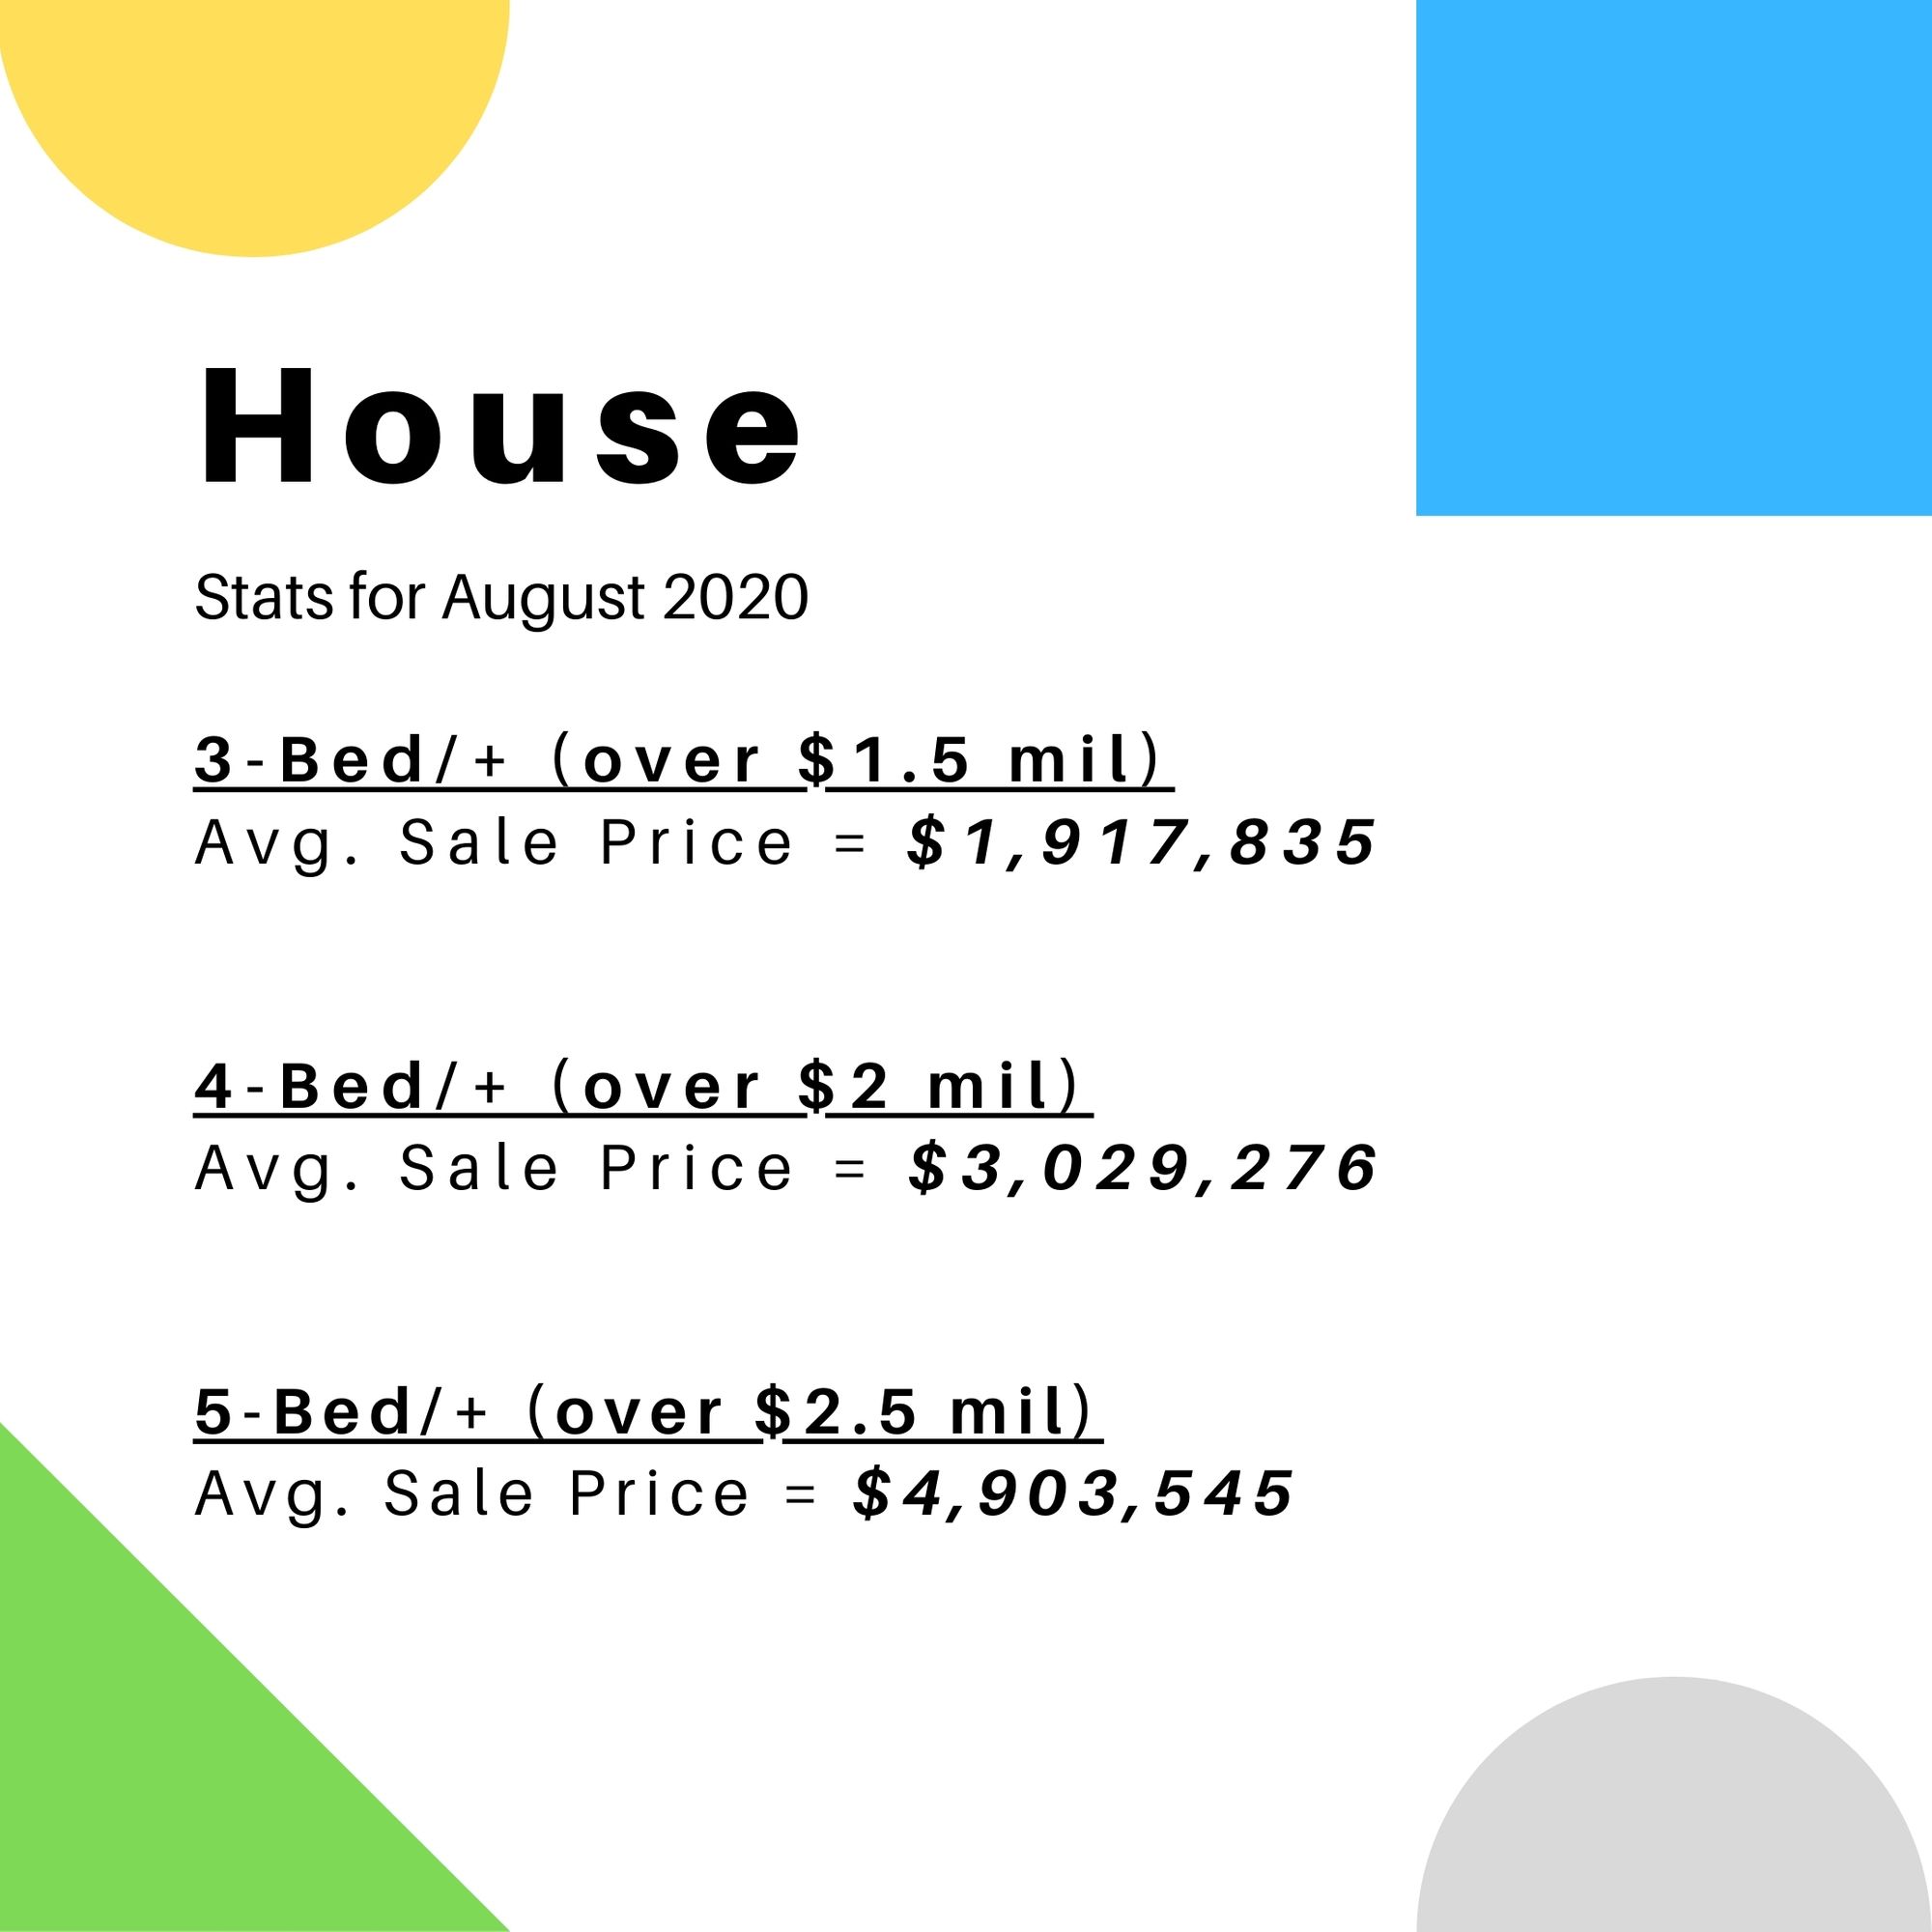
3-Bed/+
Avg. Sale Price = $1,917,835 (down 5% vs. 2019)
# of Sales = 167 (up 263% vs. 2019)
Avg. DOM (Days on Market) = 12 (down 57% vs. 2019)
Avg. % of Listing Price = 105%
4-Bed/+
Avg. Sale Price = $3,029,276 (up 10% vs. 2019)
# of Sales = 119 (up 128% vs. 2019)
Avg. DOM (Days on Market) = 25 (down 42% vs. 2019)
Avg. % of Listing Price = 99%
5-Bed/+
Avg. Sale Price = $4,903,545 (up 13% vs. 2019)
# of Sales = 25 (up 92% vs. 2019)
Avg. DOM (Days on Market) = 42 (up 13% vs. 2019)
Avg. % of Listing Price = 97%
To say that the luxury housing market was on fire in August would be a bit of an understatement.
Looking at the stats, you can clearly see a substantial increase in the # of sales compared to 2019 with 3-Bed/+ homes leading the way with a 263% gain.
The combination of a delayed spring market & increased demand for larger homes has resulted in the average sale price surging for 4 & 5-bed properties while 3-bed's have actually seen a slight downturn (5% decrease).
Although the 3-bed properties are down in average sale price compared to last year, the average days on market has also decreased by 57% which means they are selling much faster than before (now 12 days).
Most expensive condo on the market in August 2020
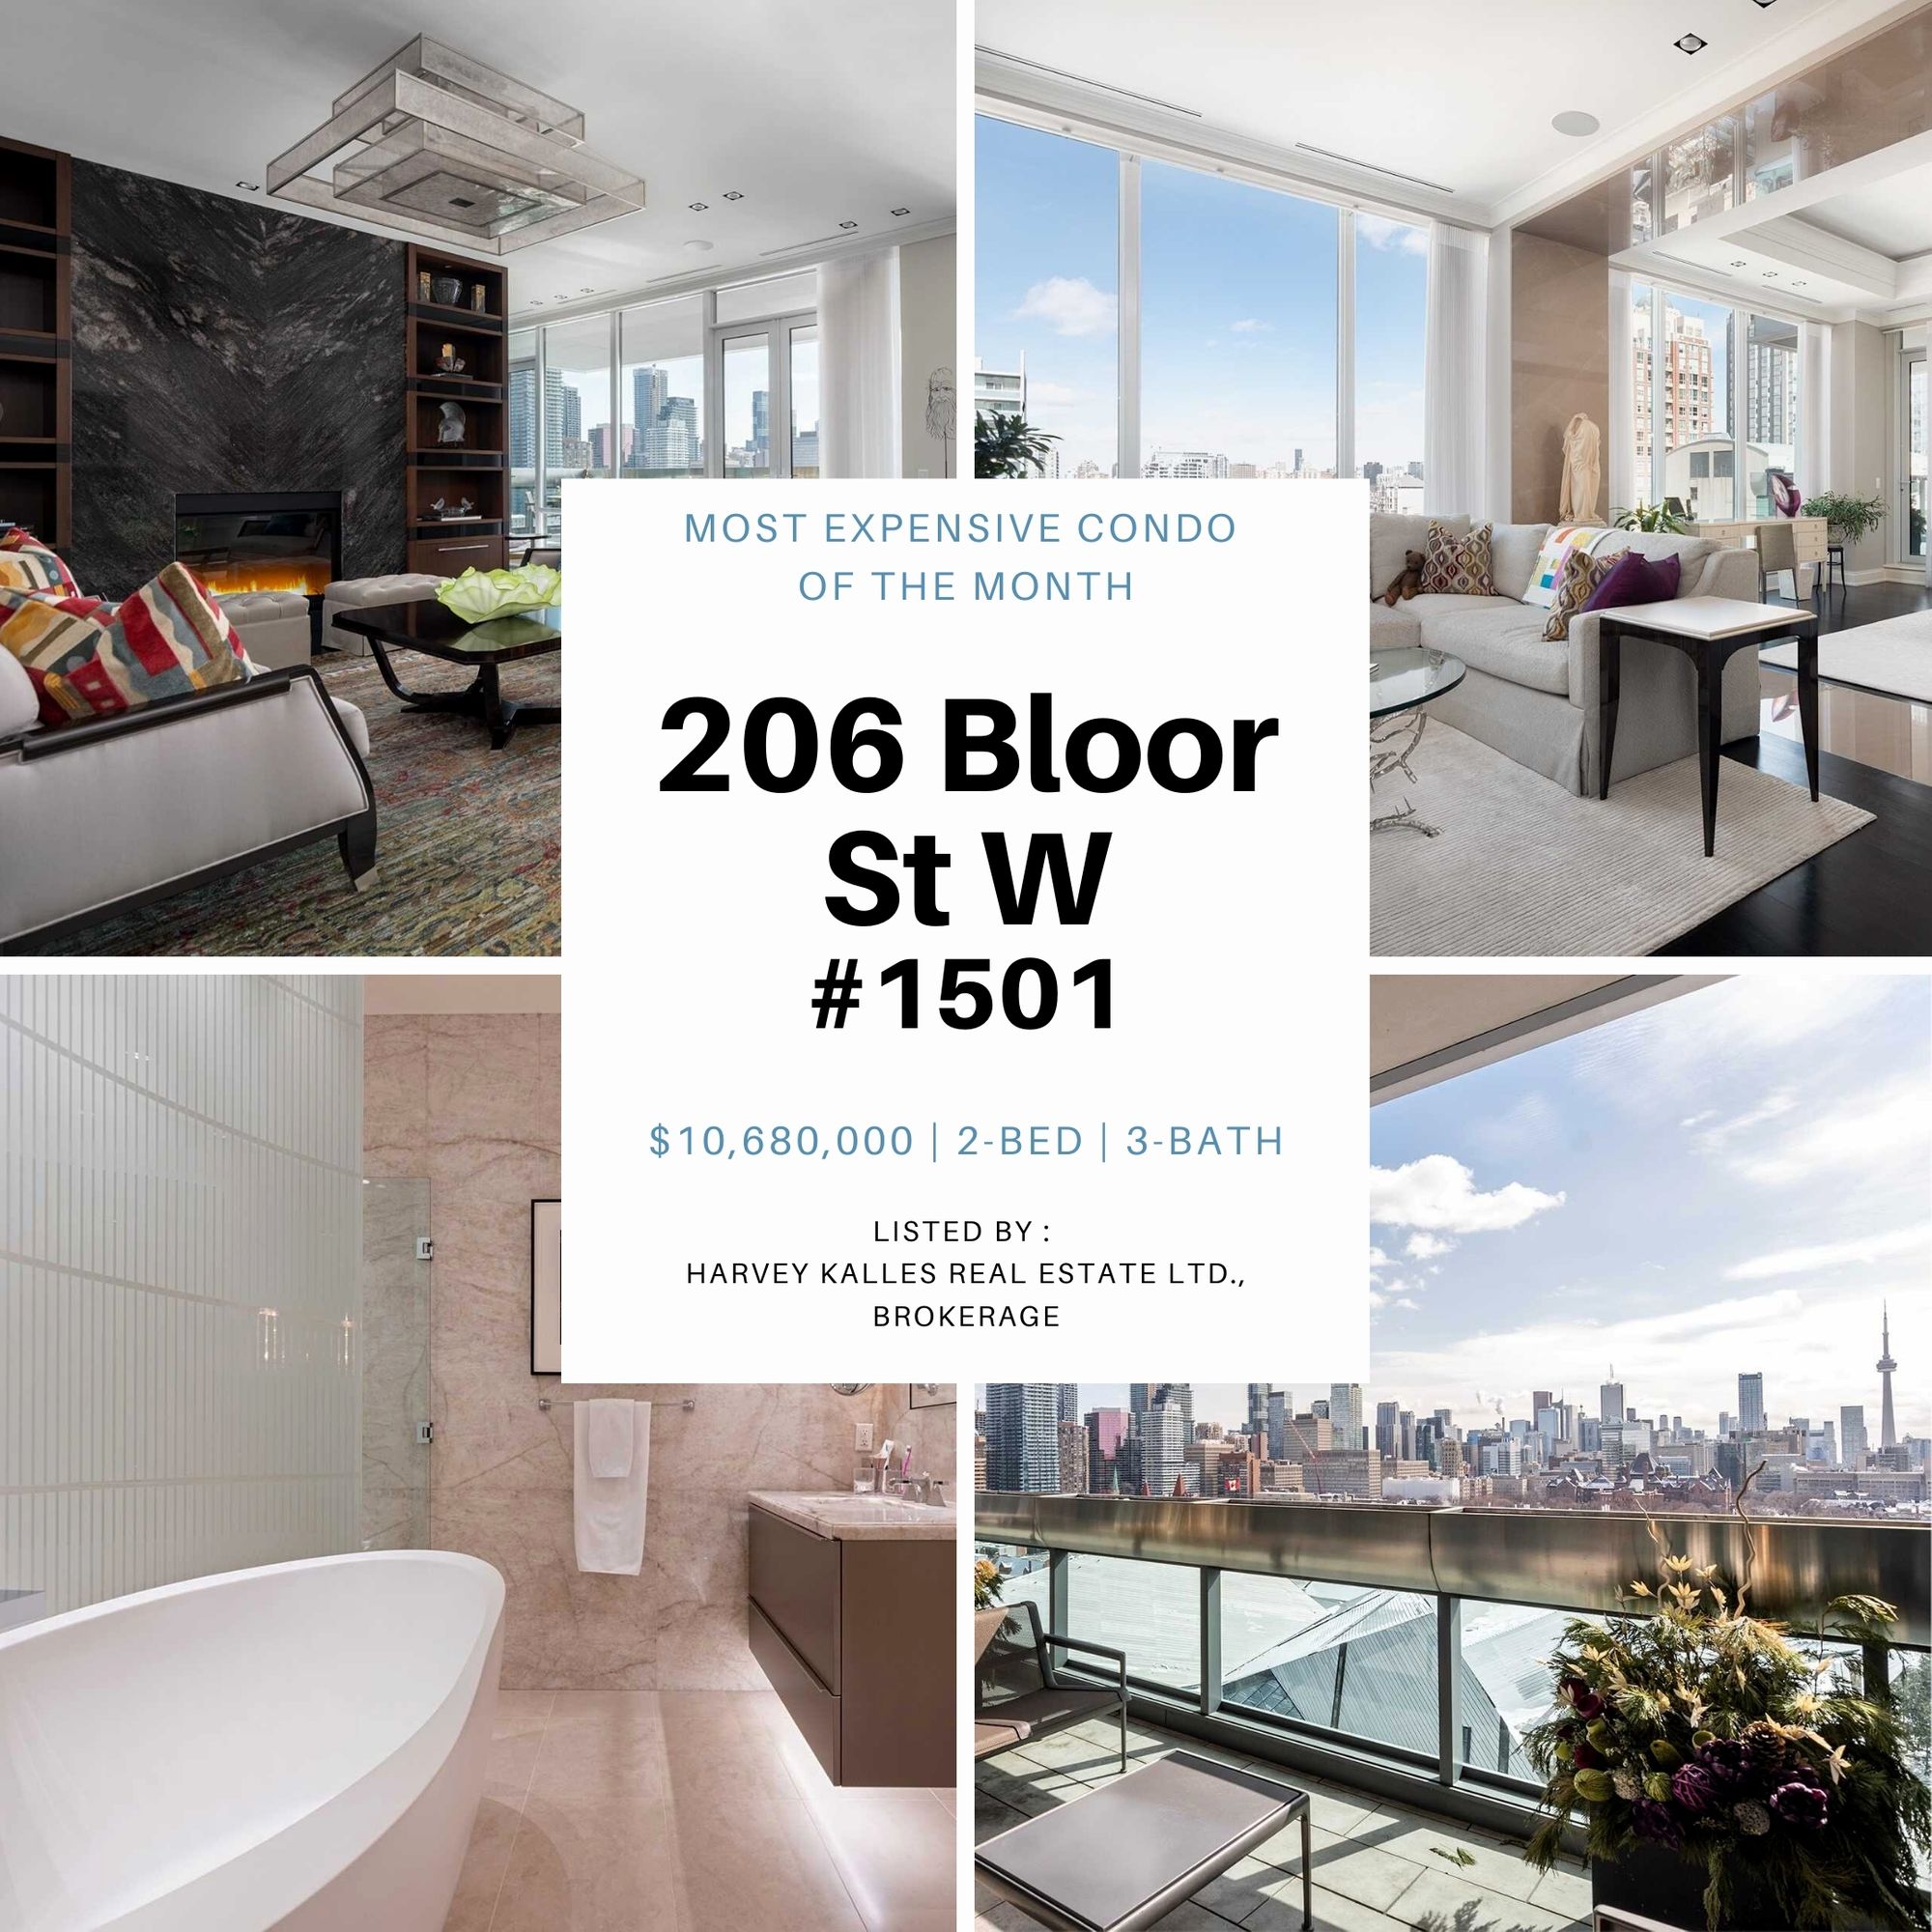
206 Bloor St W #1501 | $10,680,000
- 2-Bed
- 3-Bath
- 4,276 Sq. Ft
- Full-floor unit with private elevator
- 2 parking spaces
Most expensive house on the market in August 2020
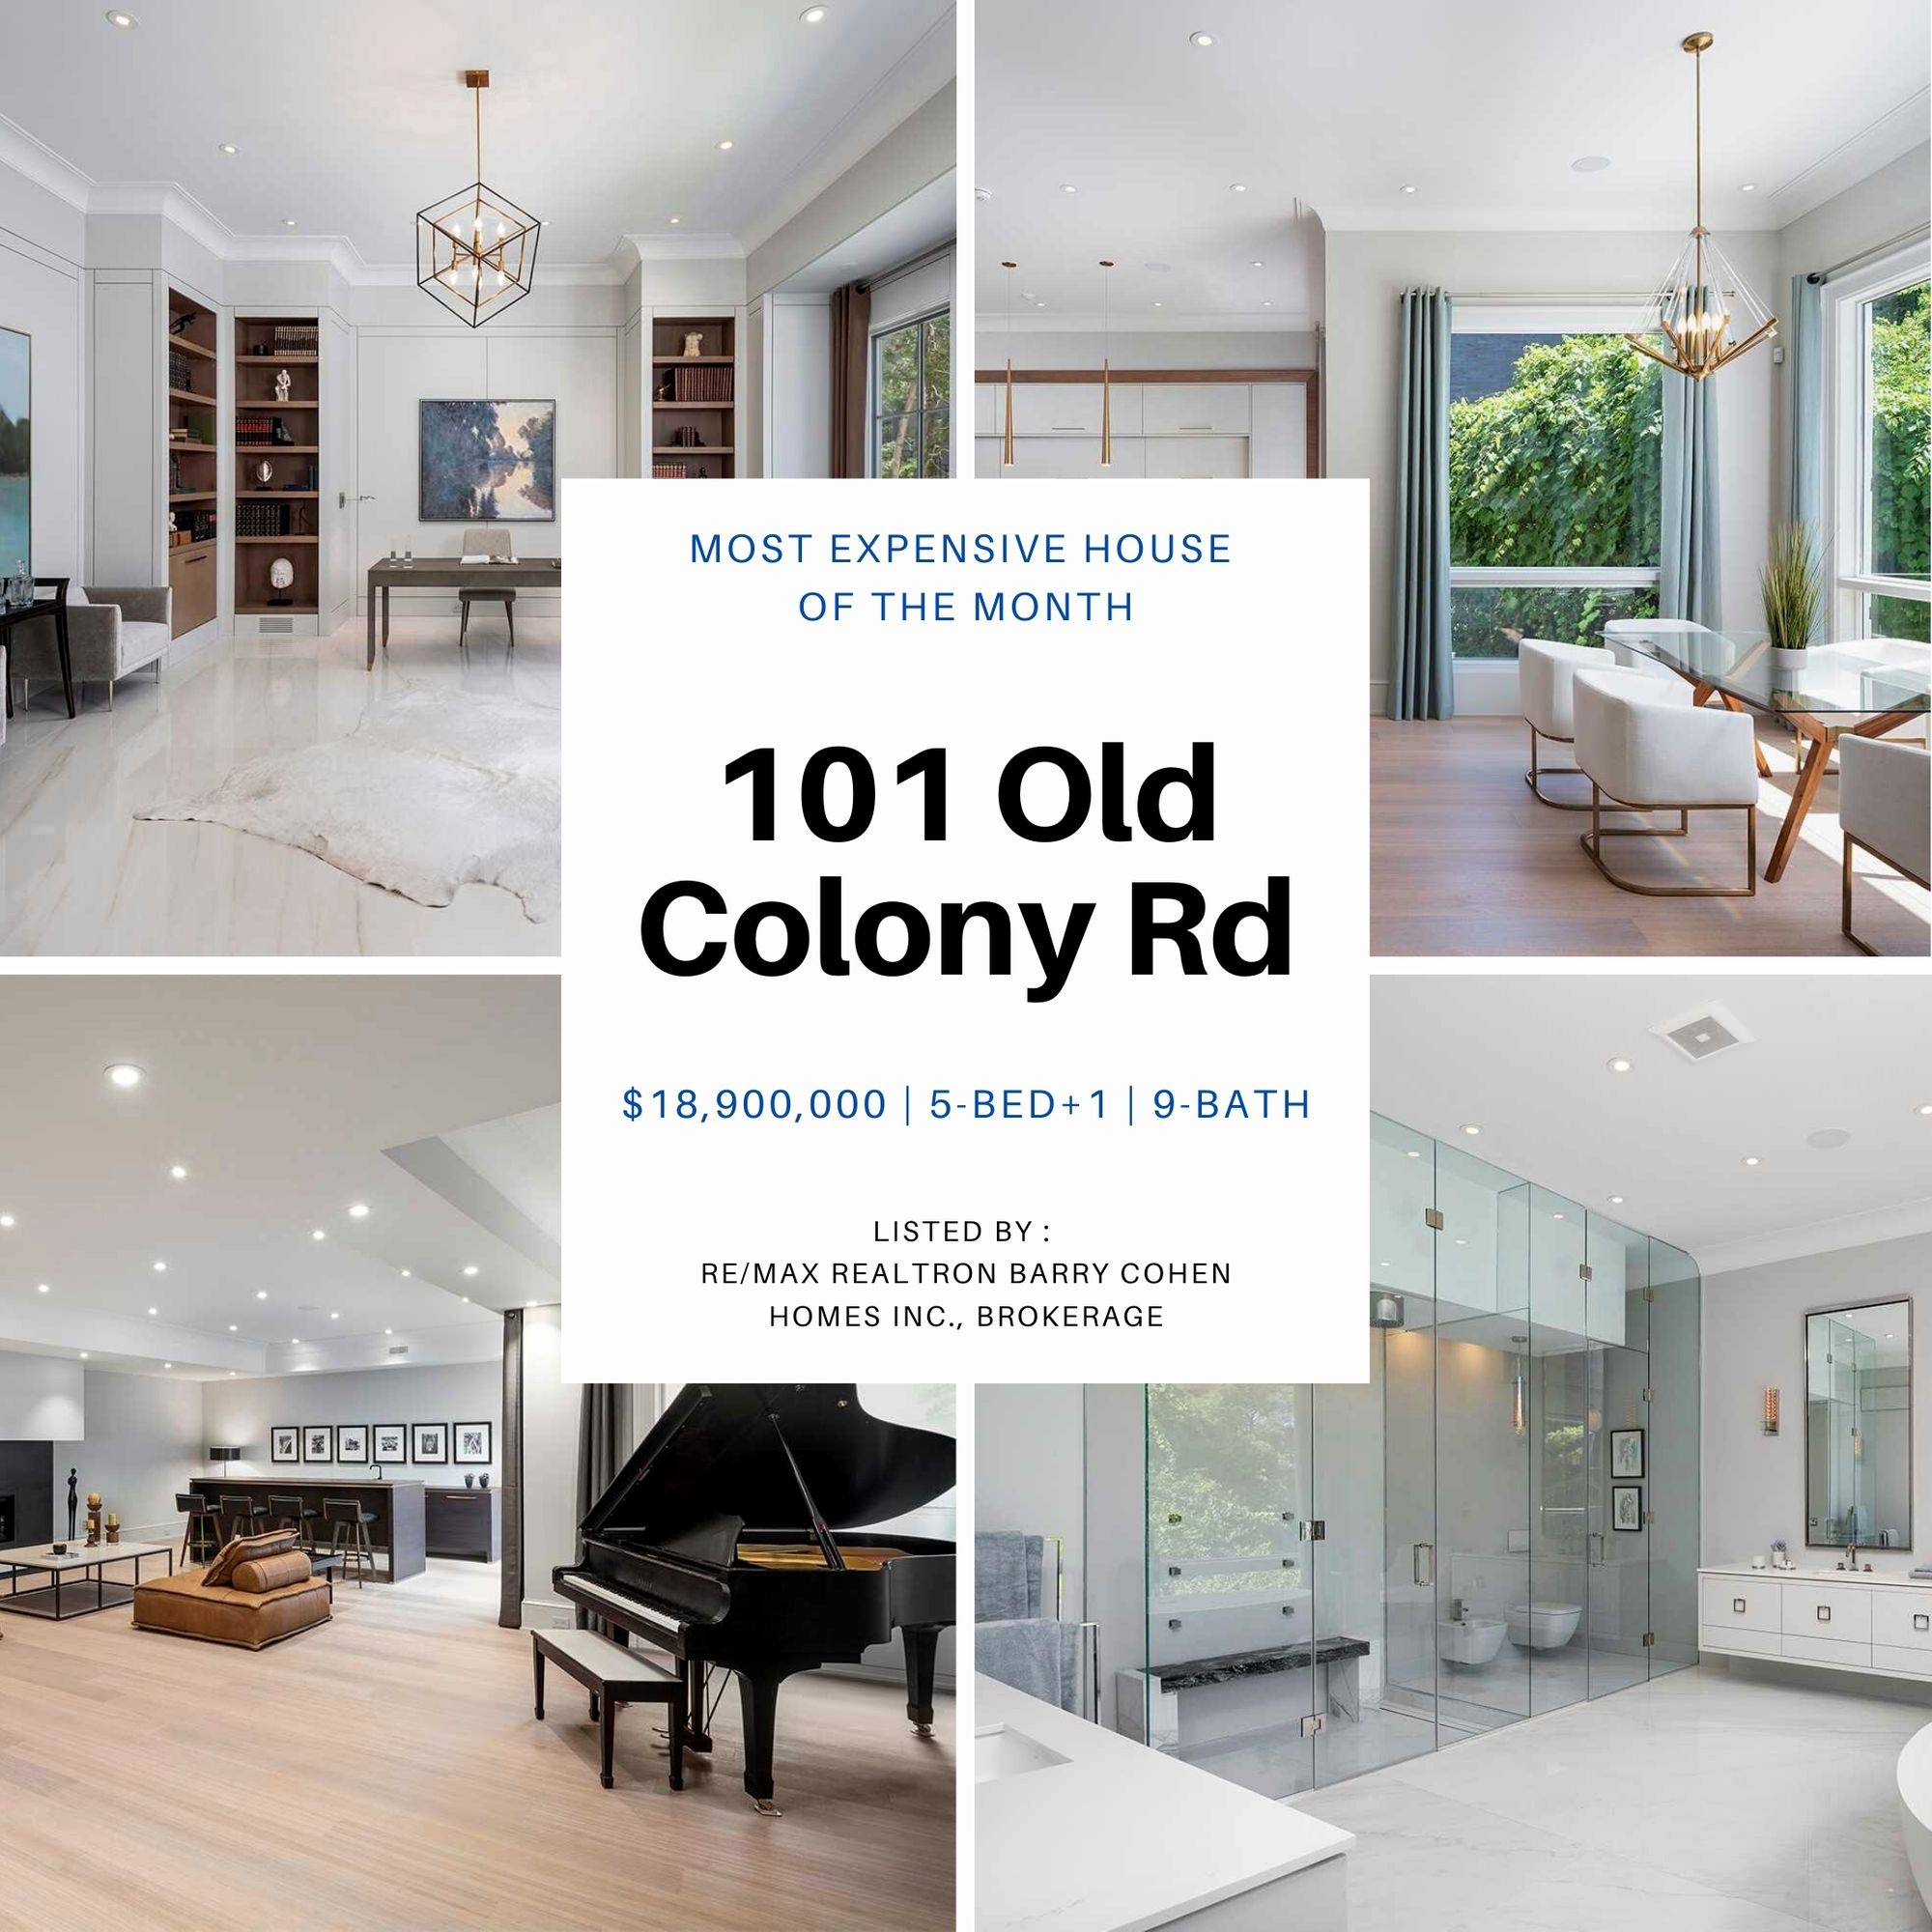
101 Old Colony Rd | $18,900,000
- 5-Bed + 1
- 9 Bath
- 15,000 + Sq. Ft
- Pool with cabana
- 2000 Sq. ft master bedroom with private terrace
- 20 parking spaces
Summary of market for August 2020
Now that we've had 2 months in a row of record sales for home in Toronto, it will be interesting to see if this trend continues as we begin our fall market which is historically known as the 2nd busiest time of the year (behind spring market which didn't get to happen due to COVID19).
Do you think it's going to be a crazy fall market for real estate this year?
Let us know in the comments section below!
Rylie C.
Sources